Part 2: the notion of implied volatility – what it is and how it is calculated.
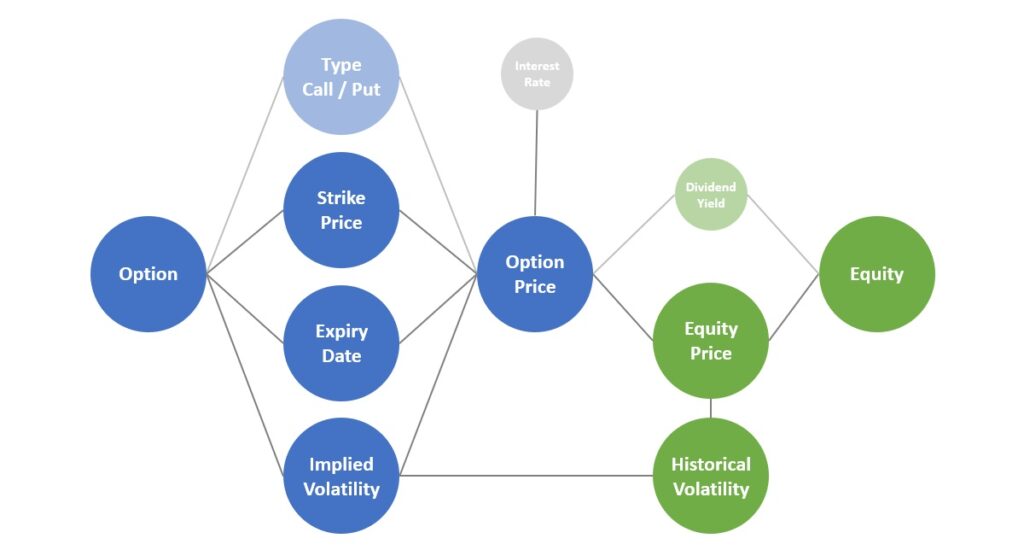
In the previous article I described three of an option’s price factors: strike price, expiry date and equity price. Implied volatility is a more complex concept to master but also essential in order to understand how an option is priced and if it is under- or overpriced.
Diagram – Adding implied and historical volatility

Before describing the “implied” part, it is necessary to explain the idea of volatility and historical volatility as they relate to equity prices. Conceptually, as the word suggests, it is the changeability of something, in this case the changeability of the option’s underlying equity price. The equity price might change a lot and so have a high volatility as is often the case with biotechnology companies, for example. Alternatively, the equity price could be relatively stable and so have a low volatility. However, “high” and “low” are not granular enough to effectively quantify volatility: a more accurate measurement using numbers is needed.
Fortunately, there is a statistical model that enables us to easily quantify an equity’s volatility using standard deviation. This involves taking the equity’s historical prices for each day over a period of, for example, one year and then measuring how much the prices vary in relation to the average price. The higher this variation in historical prices then the higher the resulting volatility. This is known as the historical volatility and is a percentage, typically ranging from 15% to 40% for equity prices.
Once we have determined an equity’s historical volatility then we can use this value to predict the equity’s future volatility. Although we don’t know what will really happen in the future, the historical volatility can be used to estimate, to imply what the future volatility should be. This implied volatility, along with the strike price, expiry date and equity price, therefore helps to determine the option price. The higher the implied volatility, the higher the option price. This is because there is a greater probability that the underlying equity’s price will change significantly over a given period of time and so reach the strike price before the expiry date.
Let’s look at an example showing how implied volatility is derived.
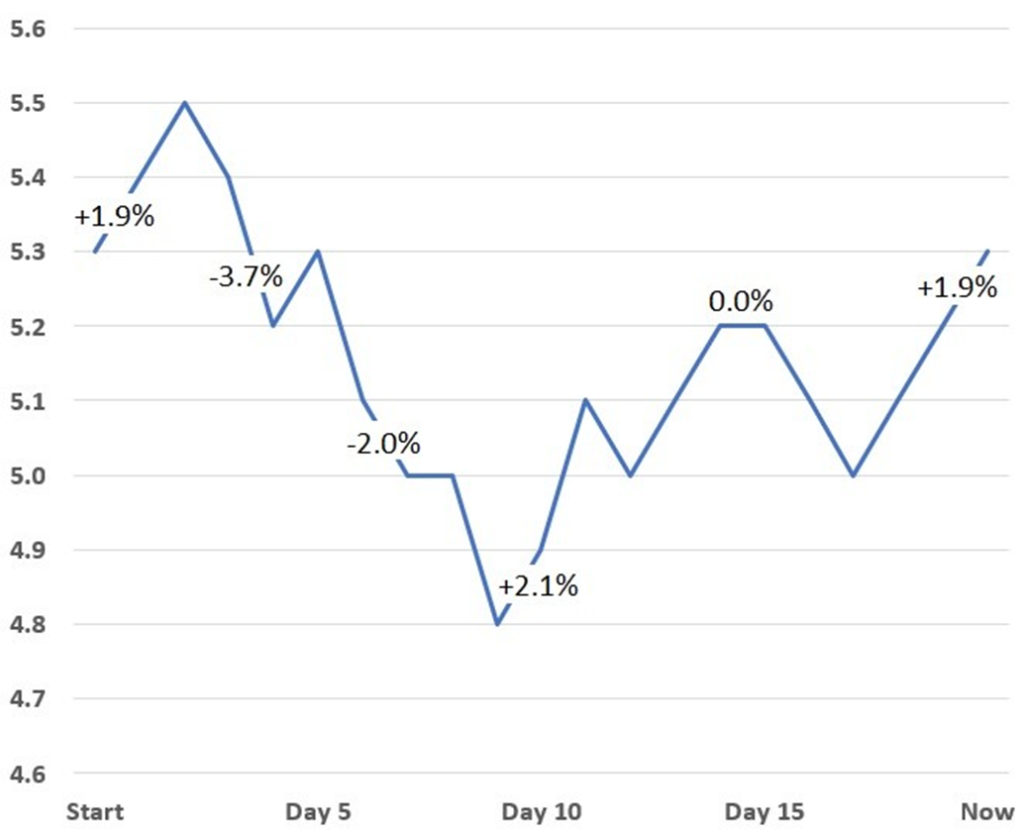
Firstly, we need a set of historical prices for an equity. Typically, a year or more of historical price would be used but for this simple example there is only a 20 day price history. I’ve added a few of the price changes in percentages to show exactly what I mean by a daily percentage change in price.
1. Historical prices and changes
Diagram 1 – Historical Equity Prices

With the complete series of historical price data it’s easy to calculate the percentage price change from one day to the next. This is shown in diagram 2 below.
Diagram 2 – Prices and Percentage Change

2. Standard deviation
We then apply standard deviation to the series of percentage changes which gives a number representing the variation of price change. Sometimes the price changes a lot, sometimes a little and sometimes not at all: standard deviation takes all of these factors into account and calculates a number for the price variation. The higher the number, the higher the variation in the price changes.
Standard deviation can be calculated either manually or by using a built-in function such as the STDEV function in Excel.
= STDEV(0.019, 0.019, -0.018, -0.037, 0.019, -0.038, -0.02, 0, -0.04, 0.021, 0.041, -0.02, 0.02, 0.02, 0, -0.019, -0.02, 0.02, 0.02, 0.019)
The result is 2.5 which means that the equity’s daily historical volatility was 2.5%.
3. Historical and implied volatility
The final step is to understand what the historical volatility really means and how it can be used to estimate how much the equity’s price should change in the future.
The 2.5% historical volatility from the example means that on any given day there was a high probability of the price changing (increase or decrease) by up to 2.5%. According to the mathematics behind standard deviation, “high probability” means that there is a 68% chance of the daily price change staying within the range of the historical volatility. Empirically, this would appear to be true given the price change only exceeded the 2.5% threshold on 4 days out of the 20 day sample.
The historical volatility can also be calculated over longer periods which gives a powerful insight into the likelihood of a price change over a week, a month or even a year. The formula for one year is as follows:
Standard Deviation * Square Root (number of working days in a year)
The annualised historical volatility for the example above is therefore:
2.5% * Square Root (252) which equals 40%.
This means that after one year, there is a 68% probability that the price of the underlying equity will change by up to 40%. That’s quite a price big range but the sample historical price data in the chart above is relatively “spiky”. This is where implied volatility comes into play: we can make a high probability prediction of future volatility based on historical volatility. In this case we are predicting that the price is likely change by up to 40% in the following year.
The mathematics behind standard deviation makes further predictions beyond this “likely” 40% annual volatility scenario:
- It predicts that there is smaller probability, a 27% chance, that the price will change by up to two standard deviations. In this case that’s a plus or minus 80% price change.
- It also predicts that there is a very small probability, a 4% chance, that the price will change by up to three standard deviations which in this case is a plus or minus 120% price change.
Unfortunately the equity markets around the world do not calculate implied volatility based purely on historical volatility. Other factors such as the outlook for the economy and a company’s quartely reporting will influence the implied volatility.